GIS to identify the italian provinces where the economic impact on minors, teenagers and their families have been more significant, due to the pandemic and the forced closure of productive activities.
Project realized for Save the Children Italia
Save the Children Italia was established in 1998 as a non-profit organization and started its activity in 1999. Nowadays it is an NGO (non-governmental organisation) recognized by the Ministry of Foreign Affairs.
It carries out activities and projects aimed at both boys and girls of the so-called developing countries and those living on the Italian territory.
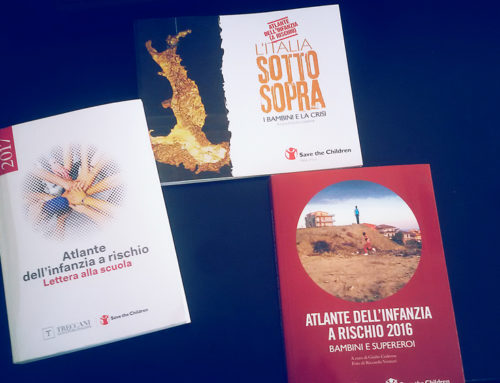
On the occasion of the launch of the campaign ‘Rewrite the future’, Save the Children is broadcasting a report that includes the unpublished survey of a sample of over a thousand children among 8 and 17 years old and their parents.
The investigation concerns the impact of the socio-economic crisis resulting from the pandemic Covid-19 on families and especially on students. The data and their mapping on the territory helps to understand which are the major elements
vulnerabilities, and in which areas are most accentuated the problems.
Needs: highlight the impact of the crisis on families in difficult economic conditions
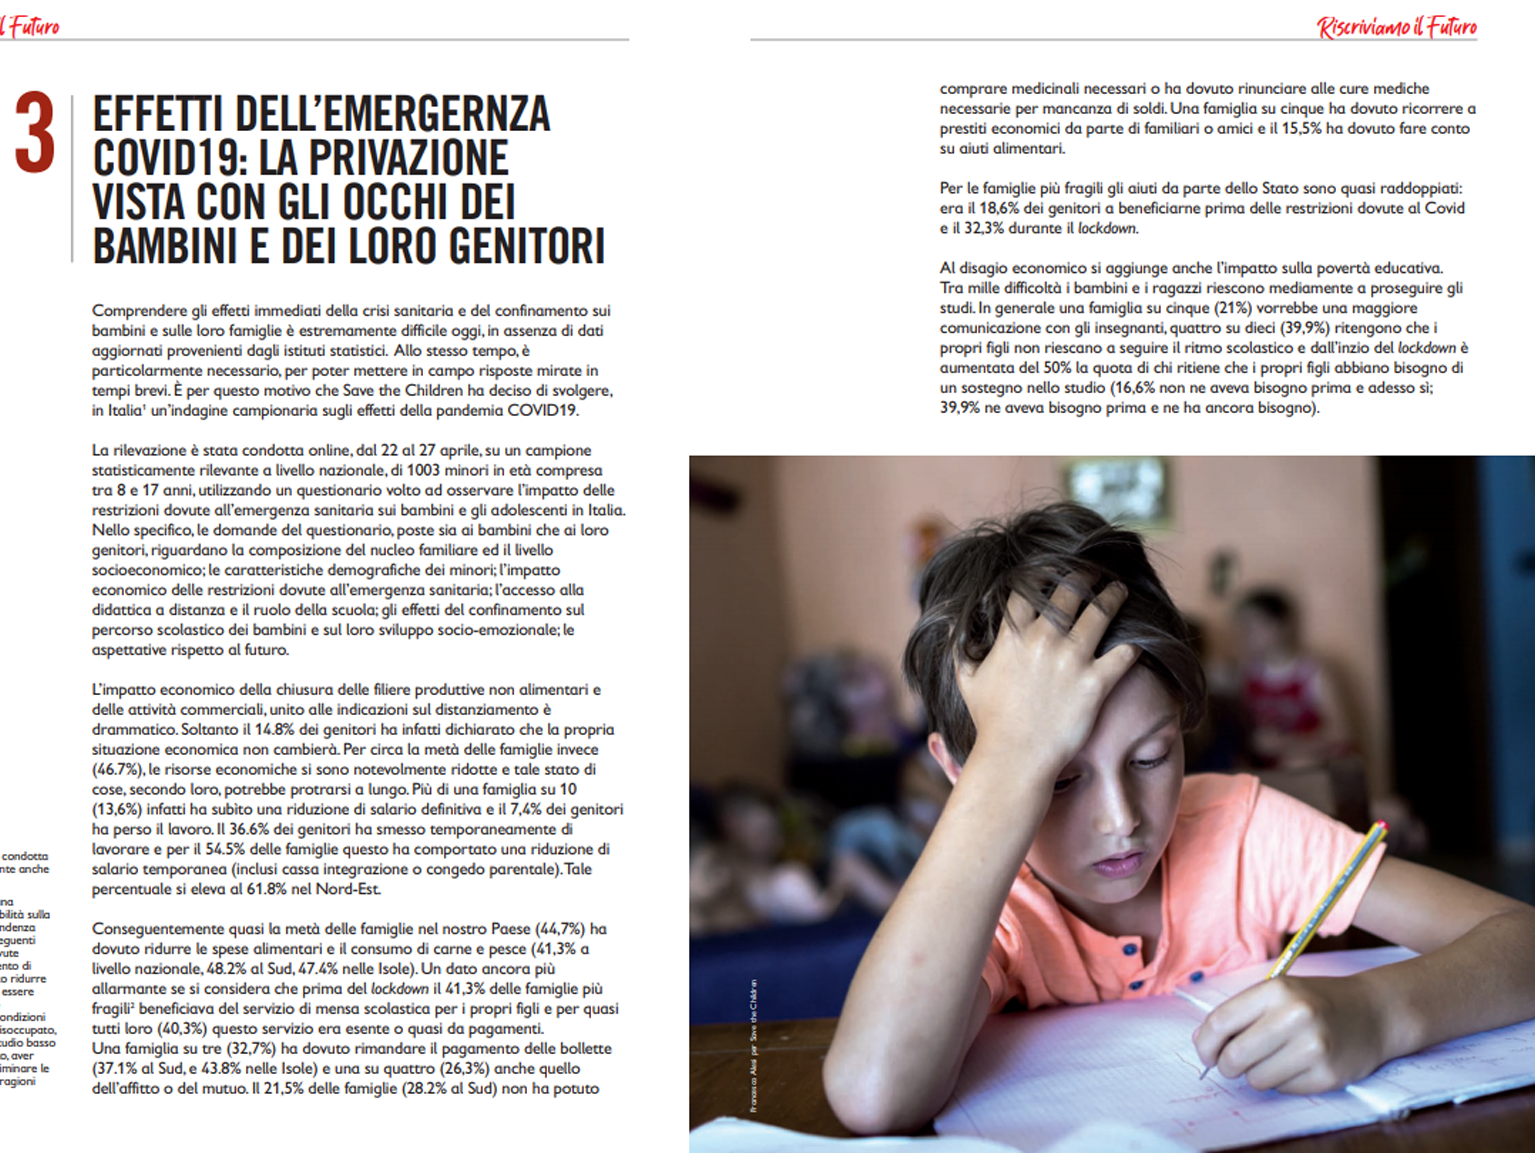
On the occasion of the launch of the campaign ‘Rewrite the future’, Save the Children has the intention to disseminate a report that includes the unpublished survey carried out by the 40 dB Research Institute” on a sample of over a thousand of children between 8 and 17 years old and their parents in relation to the impact of the socio-economic crisis resulting from the lockdown measures implemented to stem the spread of Coronavirus.
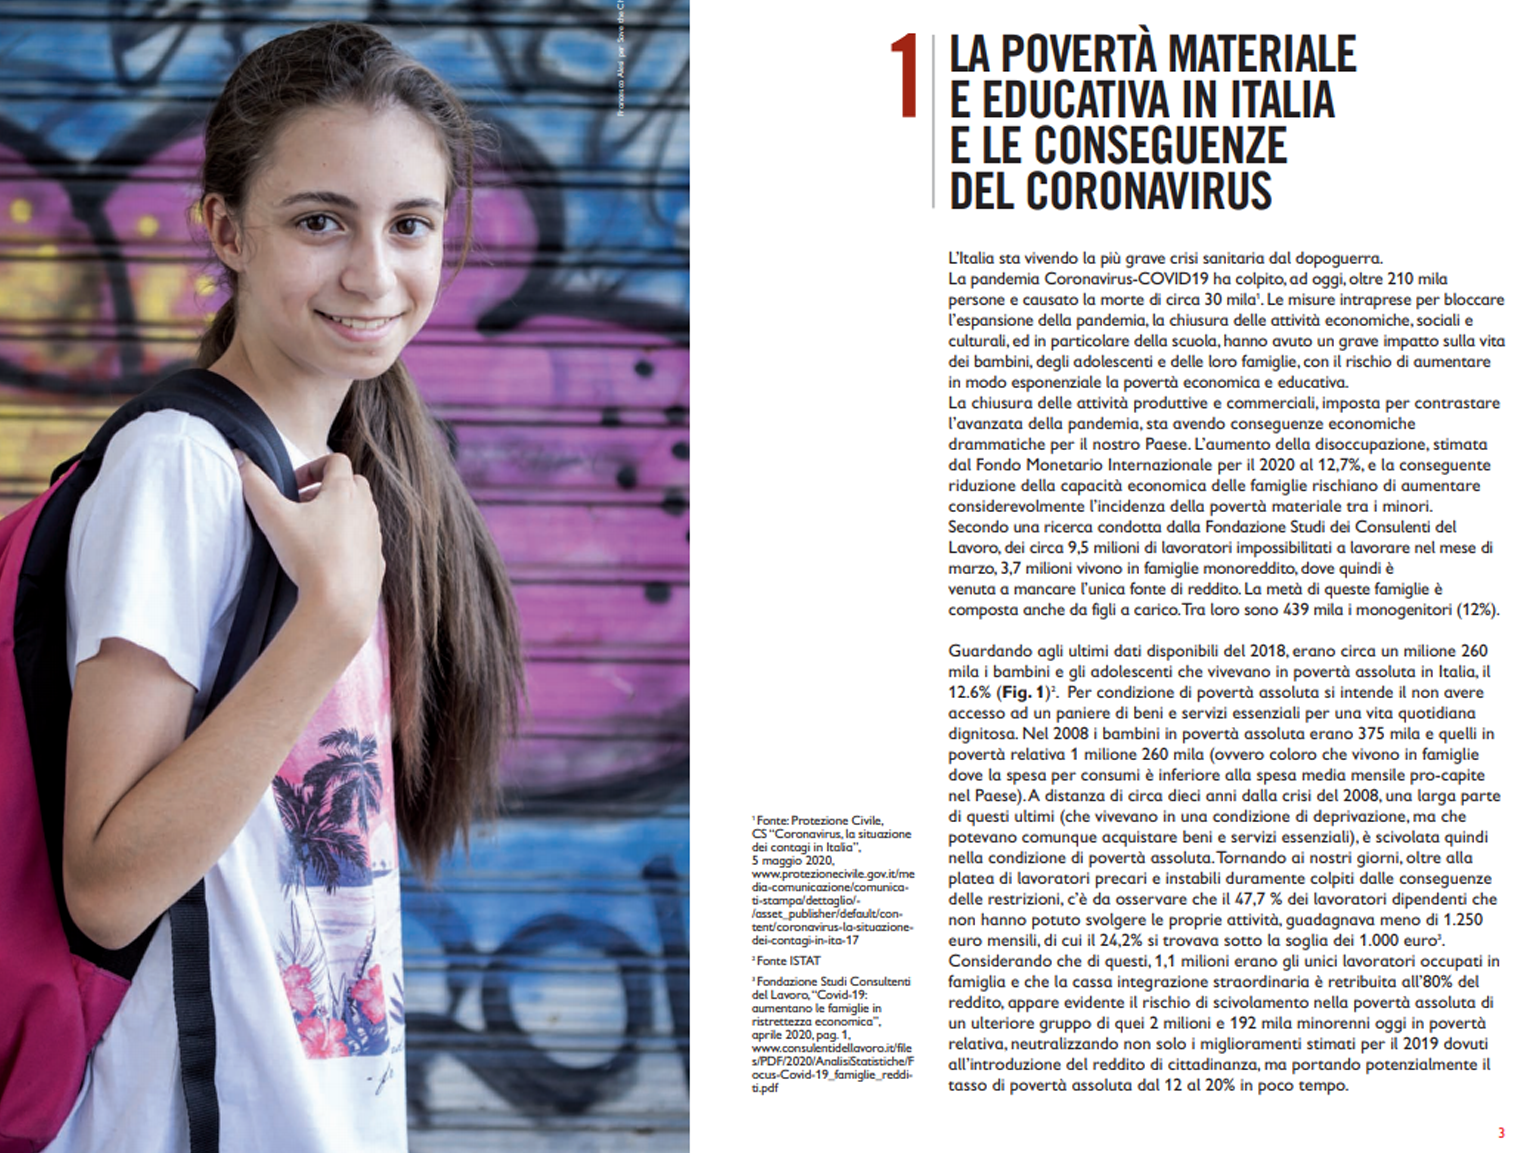
The closure of economic, social and cultural activities, and in particular of the school, have had a serious impact on the lives of children, adolescents and their families, with the risk of exponentially increasing economic and educational poverty. Closed the schools, many children are left behind. Without the tools to access the lessons, without aid, they could stop their studies forever.
National data show how the effects of the pandemic have put a strain on it mostly children who live in families in conditions of economic difficulty. More
penalized the South, but also in the North there are many territories that live with hardship.
The request was therefore to show the numbers, the most vulnerable territories and give a strong message to government agencies to take measures to combat poverty educational and school dropout.
Solution: map the educational risk
Even before the emergency linked to COVID19, our country recorded percentages of economic and material deprivation of children among the highest in Europe. In addition the levels of educational poverty is very high.
The risk is to see, in the next few years, if one does not intervene immediately, a leap forward economic and educational poverty. In fact, the long-term effect of crisis risks not only to further aggravate the situation of those who were already living in conditions of socioeconomic disadvantage, but also of those who were not in a situation of deprivation, but which can now suddenly slip into it due to the crisis.
Having these data we have created a series of “educational risk maps” for Save the Children”, to better understand which provinces in our country start from greater educational disadvantages conditions and therefore tend to be/ will be more or less prepared to facing the crisis, and at the same time, identify those provinces where the economic impact on minors may have been more significant, due to the pandemic and the forced closure of economic and productive activities.
For this purpose the following indicators have been used:
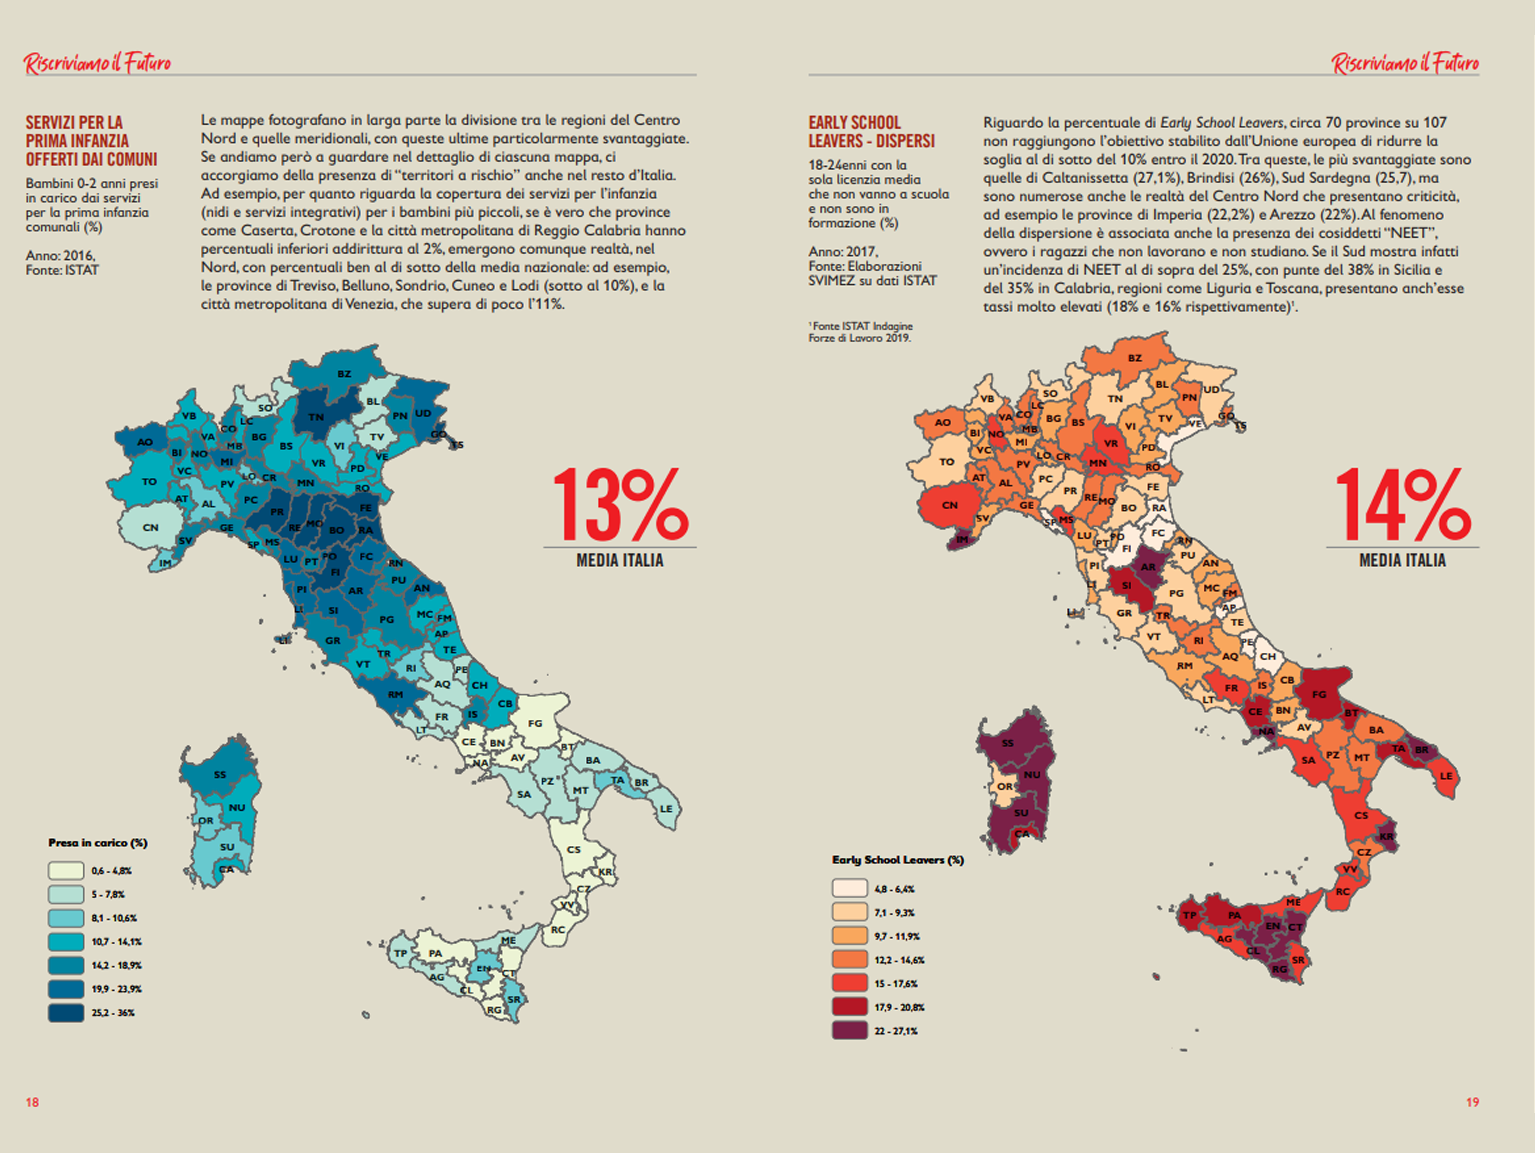
- The coverage of public early childhood education services;
- Explicit dispersion, measured through the Early School Leavers indicator, or the percentage of young people between 18 and 24 who had left their prematurely studies and therefore don’t have a secondary qualification or diploma;
- The percentage of minors aged 14-16 (attending the second year of school II degree) whose families belong to the socio-economic and cultural quintile
more disadvantaged, measured by the INVALSI; - The implicit dispersion, which measures the percentage of children under 14-16 years (which attend the second year of secondary school of II degree) that do not reach the minimum skills in mathematics and Italian, measured through the INVALSI tests;
- The percentage increase in the accepted applications for citizenship income for individuals in greater economic and social distress in March, compared to January (pre-confinement), detected by INPS.
Through the last presented map we then crossed 4 of these indicators of development / deprivation by aggregating them to define 4 risk classes, through which it is possible to understand in which of the Italian provinces the elements of vulnerability are greatest and therefore they are more at risk from an educational point of view.
Benefits: take advantage of GIS to obtain valuable information.
The use of specific GIS analysis tools gave the possibility to obtain new valuable information, by crossing data. The maps allowed to communicate the data more effectively, accessible to different levels of users.
Maps are therefore an excellent tool for:
- Improve understanding of data
- Have available the territorial analysis of the indicators;
- Understand in which areas vulnerability and hardship due to the economic impact of coronavirus is greatest