Mapping Peace: a neural language of connection
In these times, maps are often used to show destruction. They trace the scars of conflict, the buildings that no longer stand, the fields that can no longer be cultivated. But the same technology that reveals the damage can also help imagine peace and guide reconstruction.
This StoryMap was created with that intention: to use geography as a tool not of division, but of understanding, use GIS for peace.
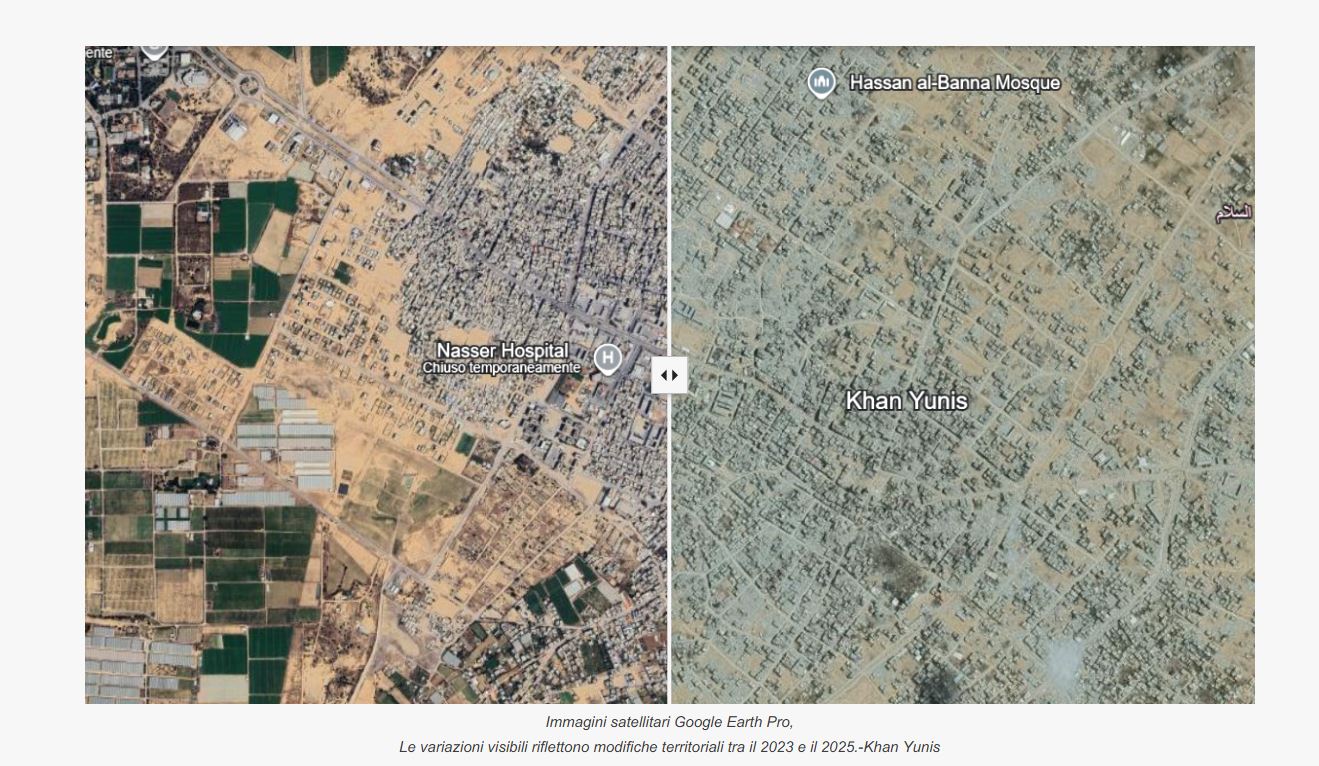
The work begins with a simple but powerful element: the comparison between “before” and “after.” By swiping across images from two different periods, the changes become impossible to ignore. Entire blocks altered, agricultural land disrupted, essential spaces transformed. This visual approach makes the impact clear and helps assess where recovery must start.
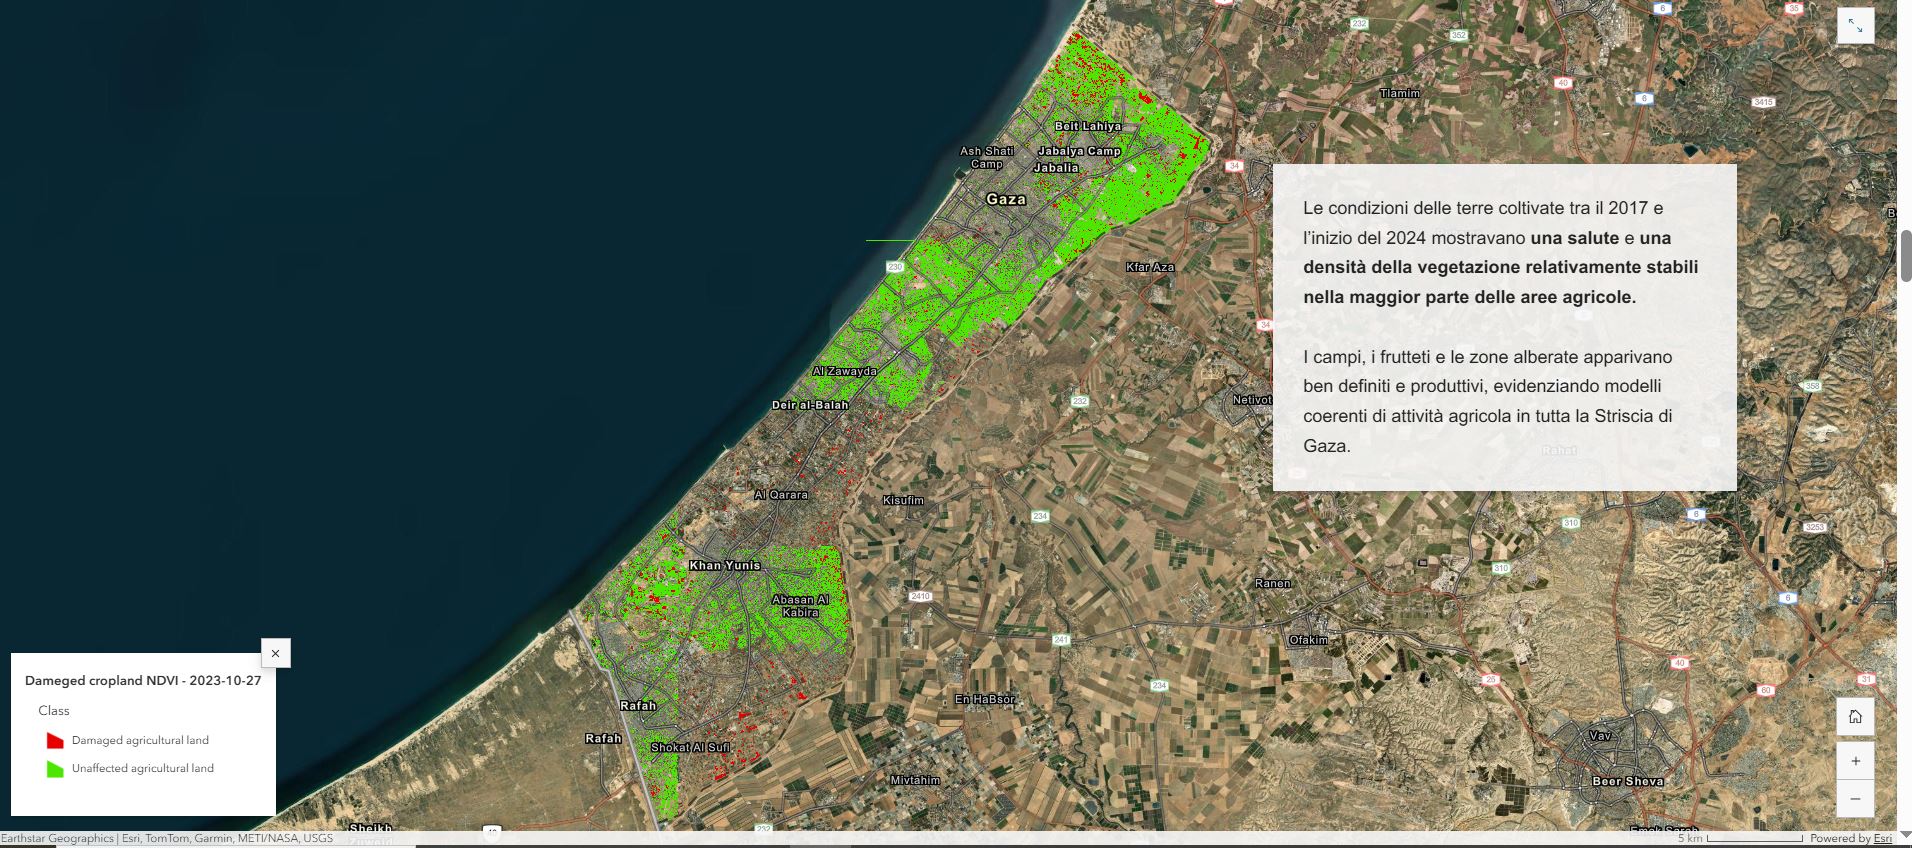
The StoryMap then integrates additional layers of information. It maps the condition of agricultural areas, showing how fertile land once looked and how it appears today. It also visualizes points of destruction and incidents affecting food systems, placing each one on the map to provide context and meaning. When data is positioned geographically, it becomes easier to understand the scale of a crisis and to communicate what is happening to those who were not there to witness it.
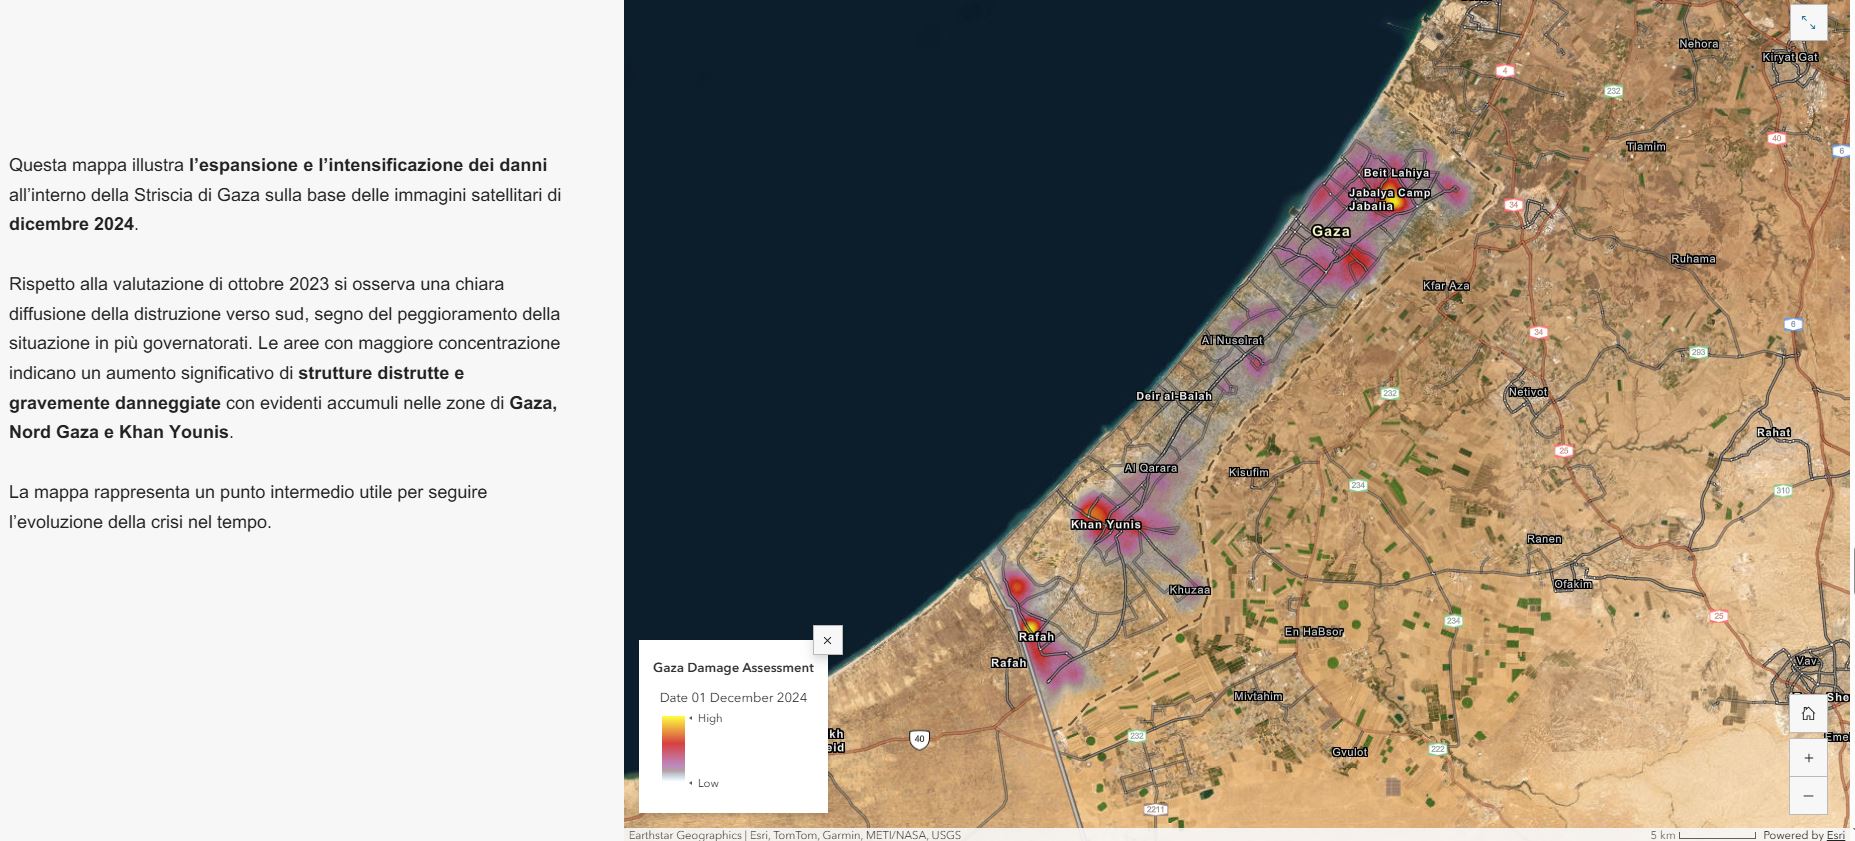
One of the most expressive elements in the StoryMap is the HeatMap, shown across three time periods. Here, color tells a story: the more intense the shade, the more severe the damage. This type of visualization helps identify patterns, concentrations, and the evolution of destruction over time, translating complex information into something immediately understandable.
This type of visualization is essential in initiatives linked to GIS for Peace, where understanding the distribution of damage is the first step toward recovery.
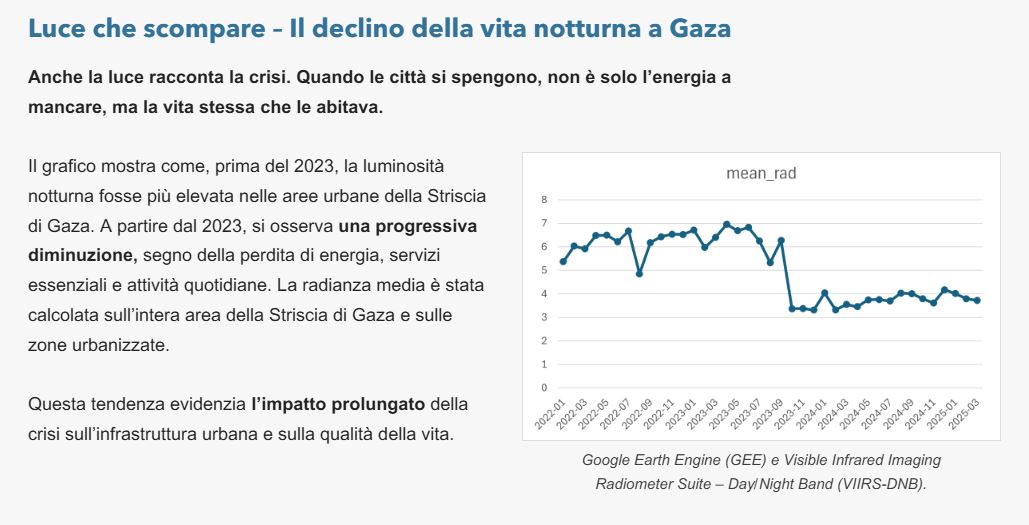
A quieter but equally telling layer is the nighttime light data. Lights that fade or disappear often signal displacement, broken infrastructure, or interrupted life. Tracking how brightness changes offers a different perspective on the impact—one that goes beyond what the eye can see during the day.
Altogether, these tools—imagery, maps, heat maps, data layers—combine to create a clearer picture of what has happened and what needs to happen next. GIS can document destruction, but it can also support recovery, accountability, and the planning of a safer future.
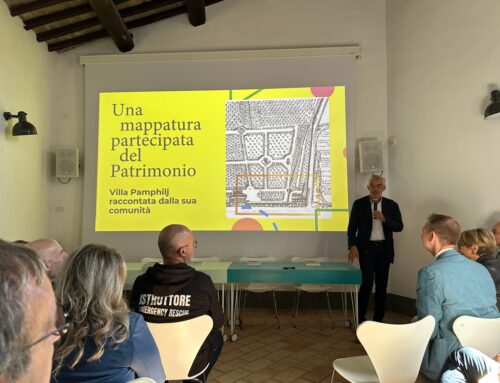
This StoryMap was presented during GIS Day Umbria 2025, a moment dedicated to demonstrating how geography can serve society. It also opens a path toward the upcoming event in Assisi, “GIS per la Pace,” where the role of geospatial technology in peacebuilding and reconstruction will continue to be explored.
This work highlights that technology is only as meaningful as the purpose behind it. Used thoughtfully, GIS becomes not just a way to map what is lost, but a way to envision what can be rebuilt.