An open virtual space for the constant collection and dissemination of information, data, analysis, and research on childhood and adolescence, available to everyone.
Save the Children’s experience in creating the Atlases of Childhood at risk over the years has generated a fundamental heritage of data, information, analysis, and research on childhood and adolescence. The Data Hub that gisAction has configured for Save the Children is the most effective way to enhance and capitalize on this wealth of knowledge.
Needs: a space for data consultation
The Data Hub project was born from the desire to innovate how data and results are disseminated. It allows us to go deeply into the annual research work on childhood and adolescence, materials that give life to each year’s edition of the Atlas of Childhood at risk.
Creating a ‘Data Hub’ means, in practice, creating a constantly updated virtual space where it is possible to interactively consult the data from the Atlas and contributions from institutions, research centers, and more, through a tool identified as the Operational Dashboards of ArcGIS Online.
The data used was analyzed, designed, and published as feature layers, in such a way that they could then be reused and downloaded in different formats by Data Hub users.
Solution: the Data Hub
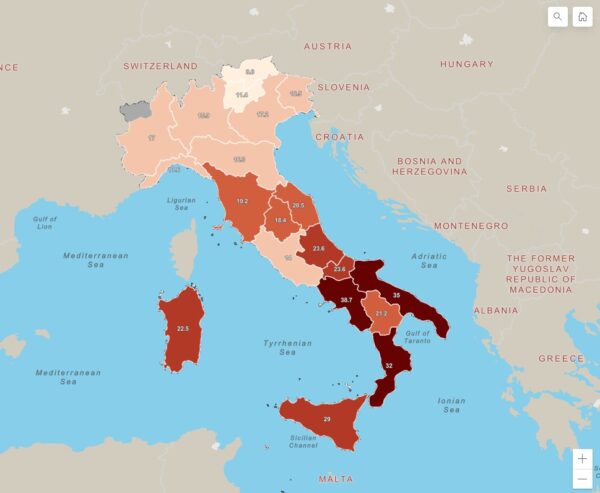
The solution we created for Save the Children is the first release of a public Data Hub on the Esri ArcGIS platform, which allows visitors to view, query, and download data related to the condition of childhood and adolescence in Italy and around the world on a map.
The most innovative aspect of the Data Hub – which makes it a solution of great value for the organization – lies in the possibility of bringing together in a single environment different consultation tools intended for different end-users.
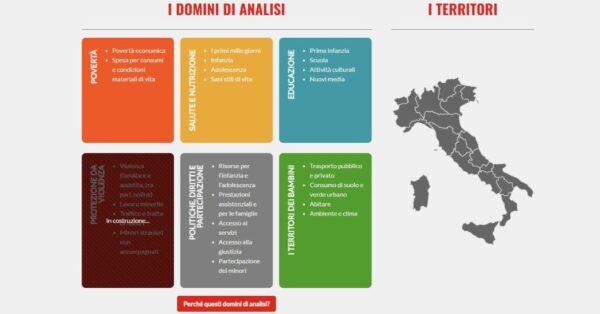
- Analysis Domains: a space dedicated to professionals where it is possible – through thematic dashboards – to stay updated on data regarding a series of areas: poverty, health and nutrition, education, protection from violence, policies on rights and participation, child-friendly territories.
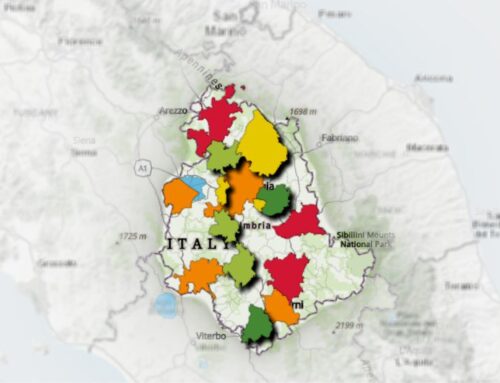
- The Territories: an important analysis that allows for dialogue with indicators and comparing territorial values on a map. An analysis that provides a snapshot of Italian territories at various levels and facilitates the work of local administrators, organizations, and associations that work every day on the territories.
- The StoryMaps: the part dedicated to disseminating Save the Children’s data and research through the power of digital geographic storytelling. There is a collection of StoryMaps from 2011 to the present.
- The Words Beyond the Data: a collection of expert analyses open to contributions from organizations and universities, freely and openly accessible.
- News: a real-time update of Save the Children’s communication activities with a link to the Twitter profile.
All of this in a single virtual space, the Data Hub. Due to the richness of the content, the Data Hub has been configured – at this time – for optimal viewing from desktop devices.
Technological components
The Proof of Concept (POC) includes the following components:
- A WebGIS platform configured with ArcGIS Online for the management, processing, organization of the content to be displayed in the Data Hub and for the loading of datasets, starting from excel files, pdfs, and more.
- A web showcase designed and branded for the sharing and organized access to content, configured with ArcGIS Hub.
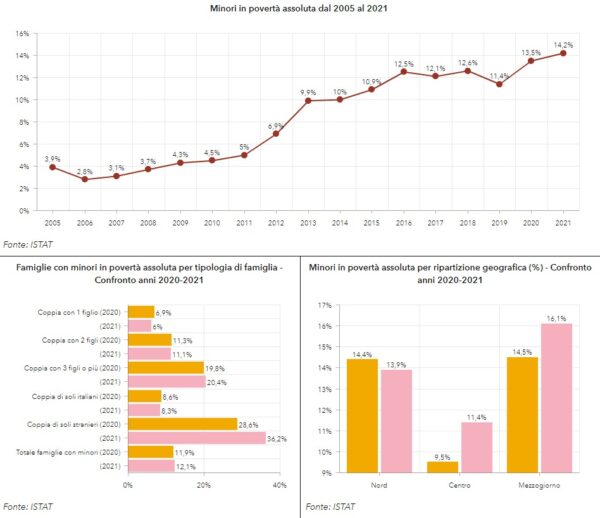
- Interactive thematic dashboards based on defined indicators of Domains and Dimensions of Analysis.
Who we worked with

Save the Children Italy is a non-profit organization established in 1998. It is part of the Save the Children International network, one of the largest independent International Organizations.
