The use of geospatial technologies in the analysis of context and in the development of policies to combat social distress and new and old poverty.
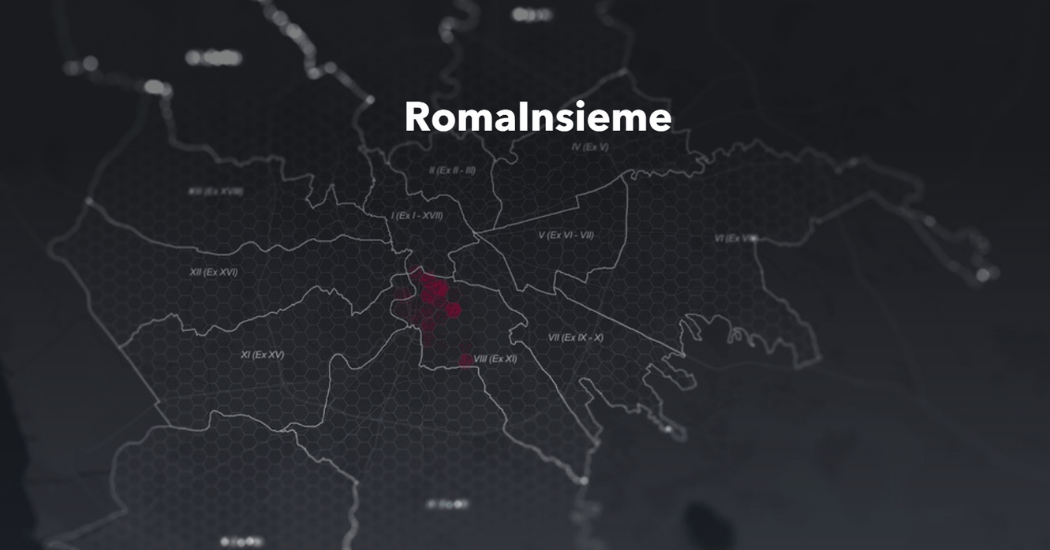
The Covid-19 pandemic has made it necessary to conduct a thorough analysis of the social consequences and, therefore, the needs of the territories. The development of an effective response by the relevant institutions requires a deep understanding of the economic and social dynamics linked to the geography of a territory, its history, and its changes. In other words, it is necessary to have information that gives decision-makers a snapshot of the needs – old and new – to facilitate the structuring of interventions to combat poverty and social distress.
The project “Roma Insieme”: a social monitoring project”
This is the thinking behind the experimental project “Roma Insieme”: a project designed and implemented by Stand Up, supported by the Charlemagne Foundation and the VIII Municipality of Rome, with the technological support of gisAction and the consultancy of the CasaRoma Observatory. “Roma Insieme” was created with the idea of conducting territorial analyses that also take into account that segment of the population that generally does not turn to Social Services, and therefore escapes institutional detection of needs. Only with the involvement of citizens and the operational and strategic collaboration between volunteer associations, parishes, businesses and all those intermediate bodies of civil society, it is possible to access the data necessary for an integrated analysis that allows for an exhaustive understanding of the phenomenon. For one year, from the last semester of 2021 to the first semester of 2022, 1300 families were welcomed by the network of volunteers operating in the VIII Municipality. A questionnaire, anonymous and voluntary, was submitted to about half of these households – 596 families – to reveal their socio-economic problems.
The role of geographic technologies
The value of the “Roma Insieme” project begins with the choice of tools for conducting the analysis, as a result of an awareness of the role played by data governance and the exchange of information in social monitoring (here we talk about GIS and Mapping).
The project has experimented with an innovation path based on the digitization of the workflow and data and on the integration of the geographical component, thanks to the support of gisAction. The development and use of Web GIS technologies have allowed the combination of connected solutions that support the process as a whole, from the collection of geolocated data, their aggregation, and their dissemination, each responding to specific needs.
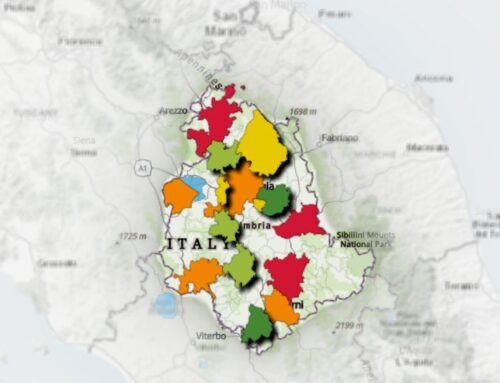
The data, collected and geolocated through a digital form, are automatically available in a dashboard that shows the aggregated data in dynamic and interactive graphs and also on a map. This allows, in addition to continuous monitoring of the situation, to be able to analyze the data based on thematic screens – family nucleus, work scenario, housing condition, etc. – that can be elaborated and modified according to the needs. Each parameter can be isolated to allow for targeted analysis such as on foreign households, on the elderly, on public housing occupants, on workers in the catering sector and others.
The simultaneous visualization of data on a map and in graphs helps to understand the relationships and correlations between factors and reveal dimensions of vulnerability.
A system serving decision makers
Mapping vulnerabilities and networking resources are fundamental elements in understanding the phenomenon and providing an appropriate response. In most emergency situations, social morphology and geography interact to highlight vulnerable populations.
The territorial involvement of social volunteer operators together with the use of GIS technology and future integration with municipal social services could allow for a system of understanding the city’s needs that can reveal new forms of poverty that are difficult to detect with traditional research tools.

