The Last20 Report 2026, by Tonino Perna and Ugo Melchionda, analyses the twenty countries with the lowest per capita income in the world. It does so through 39 indicators grouped into eight dimensions: economy and finance, demography, social rights, governance, conflict and security, climate, human mobility, and each country’s position in the world-system. For each indicator it reports the values for 2005, 2015, 2020 and 2025, the Last20 mean and median, and a comparison with the G20, using data from the World Bank, the IMF, UN agencies, UNHCR, SIPRI and other international sources. It closes with ten operational conclusions for policy and cooperation.
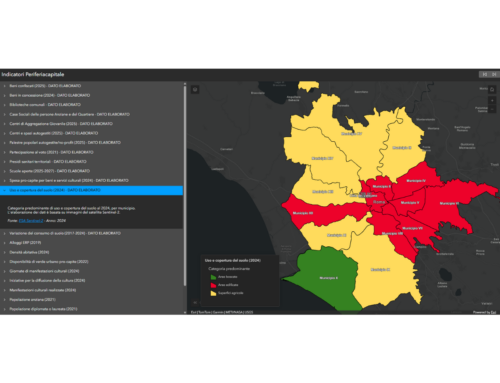
It is a dense document, built on tables that hold a great deal of information but do not easily show how the different elements connect. That is why TeamDev Ecosystem, with gisAction, turned the report into the StoryMap The Last20: ai margini dell’economia mondiale (in Italian): a journey through interactive maps, charts and stories that brings Tonino and Ugo’s work to life, makes the data easy to explore even for non-specialists, and helps readers see what lies behind the numbers.
Who the Last20 are
The journey begins by defining the group: seventeen countries at the bottom of the IMF’s 2025 income estimates, plus Eritrea, Syria and Lebanon, for which official estimates are missing but the evidence is clear. A world map shows them together.
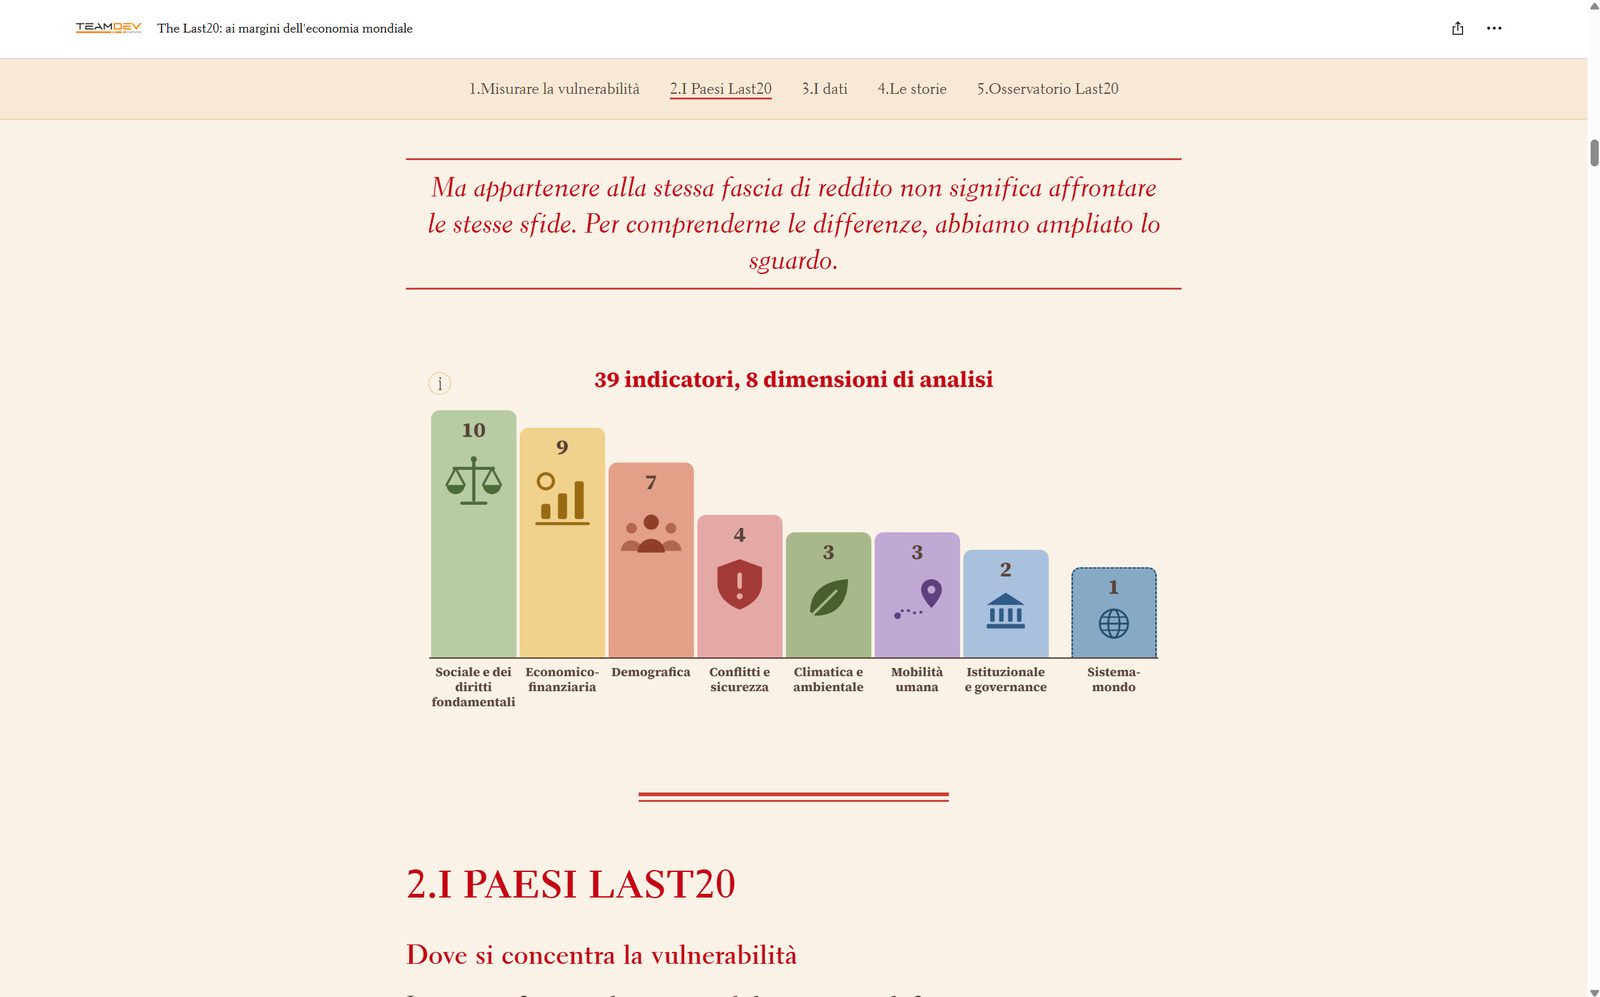
The aim is to make clear from the outset that an income ranking is not enough. These countries share very low incomes, but not the same path. Some are growing, others have been hit by sudden crises, and many face conflict, demographic pressure and climate risks all at once. That is why the report uses 39 indicators, and why we explain them before showing any data.
Where vulnerability is concentrated
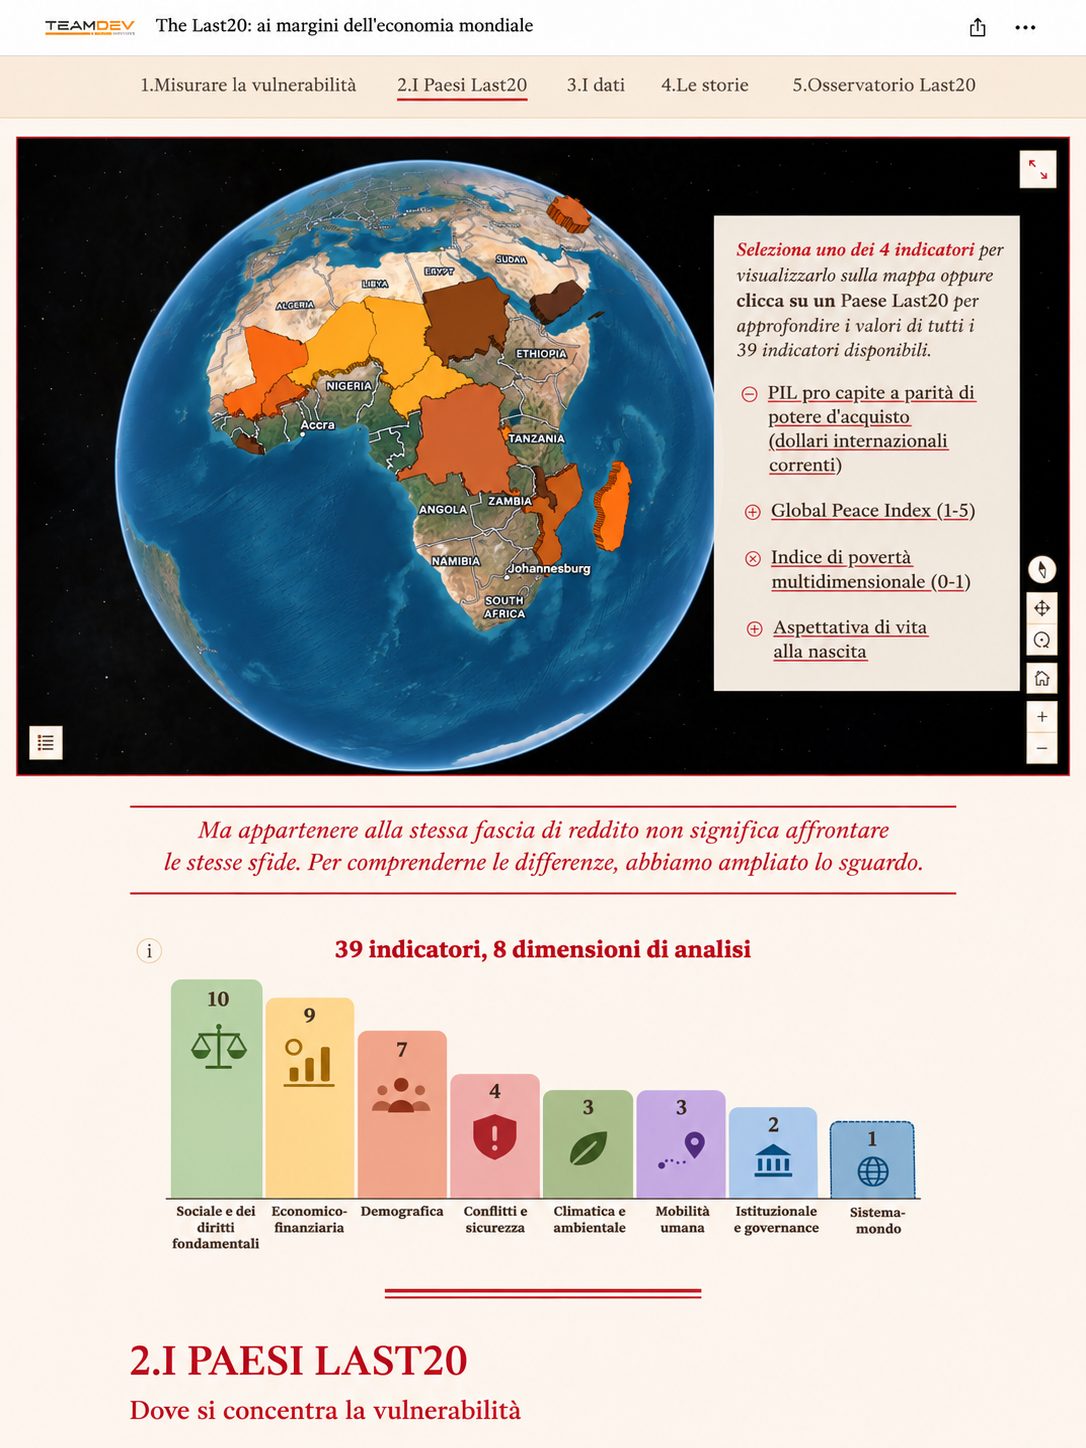
The countries stretch from sub-Saharan Africa to the Middle East, from South Asia to the Caribbean. An interactive map lets users choose between four indicators (GDP per capita at purchasing power parity, Global Peace Index, Multidimensional Poverty Index and life expectancy) or click on a country to see its values for all 39 indicators.
Geography does not determine a country’s destiny, but it shapes its opportunities and limits. With this map, anyone can explore it for themselves, with the report’s entire dataset just a click away.
What the data tell us
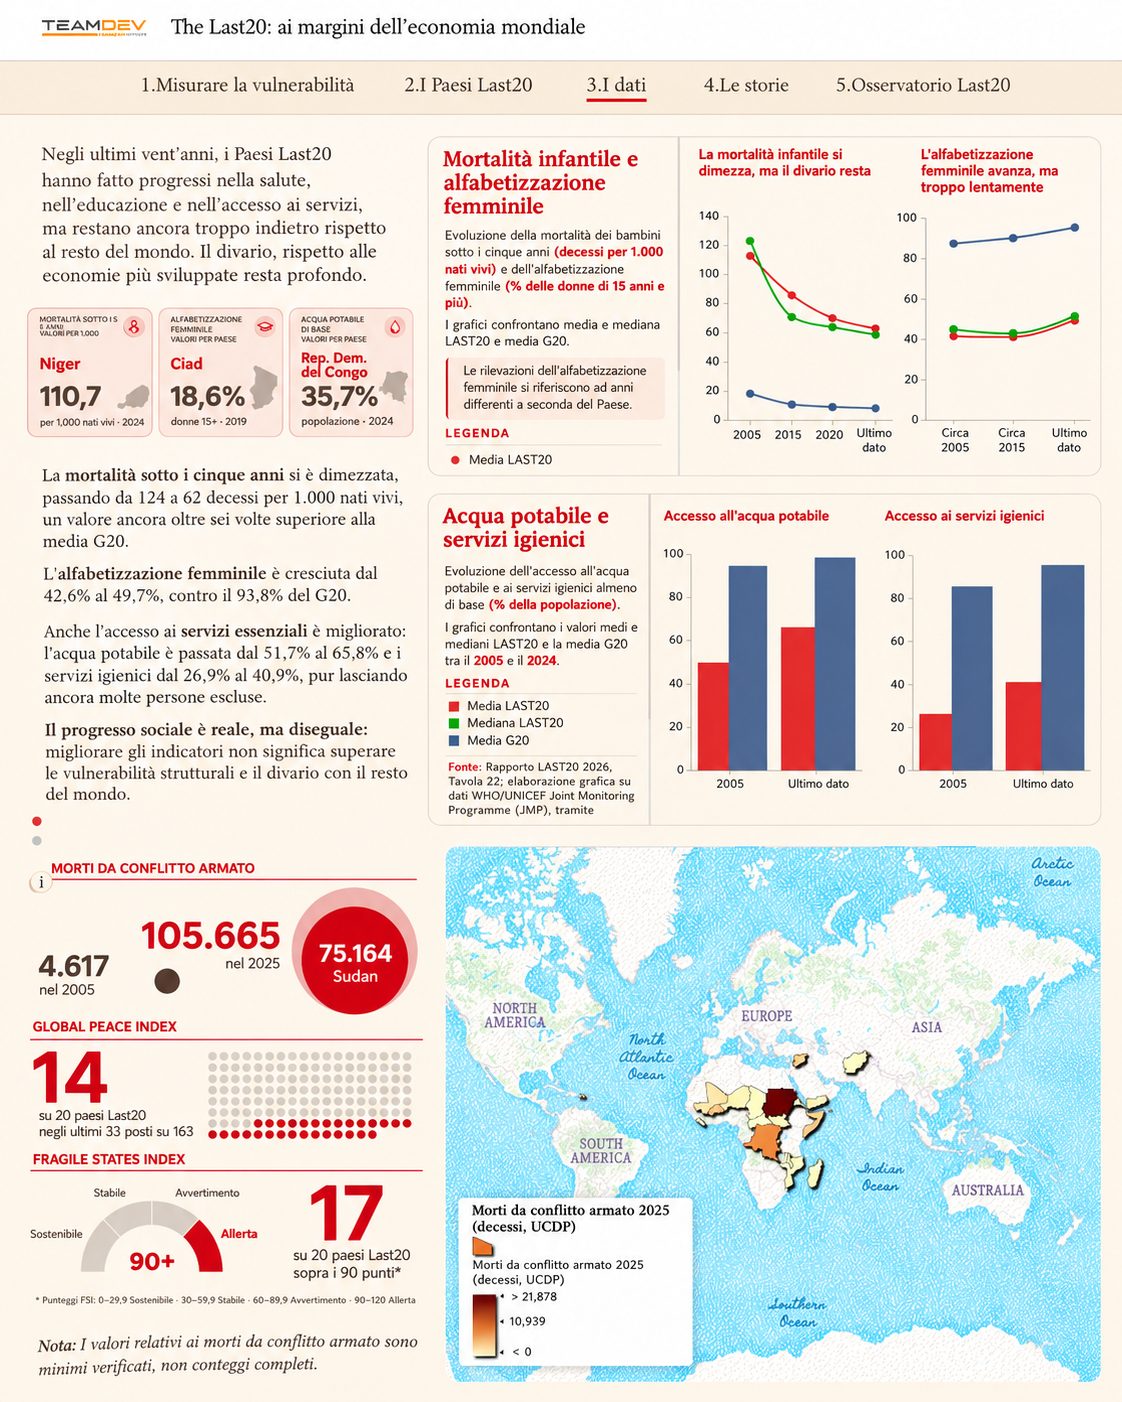
The data are organised into five themes. Each opens with a question and closes with a short summary of what emerges.
- Economy. A line chart indexed to 2005 compares the Last20 mean and median with the G20 to answer one question: does growth mean catching up? No. The Last20 median grew by 58%, the G20 mean by almost 105%, and the gap kept widening.
- External relations. Maps of external debt, development aid and remittances, followed by a chart that sorts the countries into four dependency models, each defined by a threshold: aid-dependent states, remittance economies, foreign-investment enclaves and “island” states without reliable data. The idea is to show that vulnerability also depends on decisions made by creditors, donors and the countries where migrants work.
- Human development and living conditions. A Global Hunger Index map with a focus on Sudan shows how armed conflict can turn food insecurity into famine. Three indicators (under-five mortality, female literacy, access to water and sanitation) show real but uneven progress, while a section on young people explores what rapid population growth means for schools, healthcare, housing and jobs.
- Climate. Per capita CO₂ emissions compared with the ND-GAIN index, to make visible the gap between those who contribute least to climate change and those least equipped to face it.
- Human mobility and conflict. One map compares refugees and internally displaced people in 2025, making visible the millions forced to leave their homes without ever crossing a border. A final map links fragility and armed conflict, with deaths shown as verified minimums, as the report itself treats them.
Seven countries, seven stories
After the data, the focus shifts to places and people. A map tour opens seven country stories, which can be reached by clicking a country in the list or its marker on the map.
Poverty is not the starting point of these stories. Some of these countries have made concrete progress, others have gone through deep crises, and others still face major challenges with very limited resources. Seven different trajectories that averages alone would hide.
Towards a Last20 Observatory
An annual report captures conditions at a given moment, but these countries keep changing, often differently from one area to another. That is why the StoryMap closes with a proposal for a Last20 Observatory, built around a GeoData Hub that brings together statistical data, geographic information and contributions from the field.
The idea is to move from a periodic snapshot to knowledge that is up to date, shared and rooted in local contexts, open to researchers, institutions, organisations and local communities wishing to contribute.
The presentation in Assisi
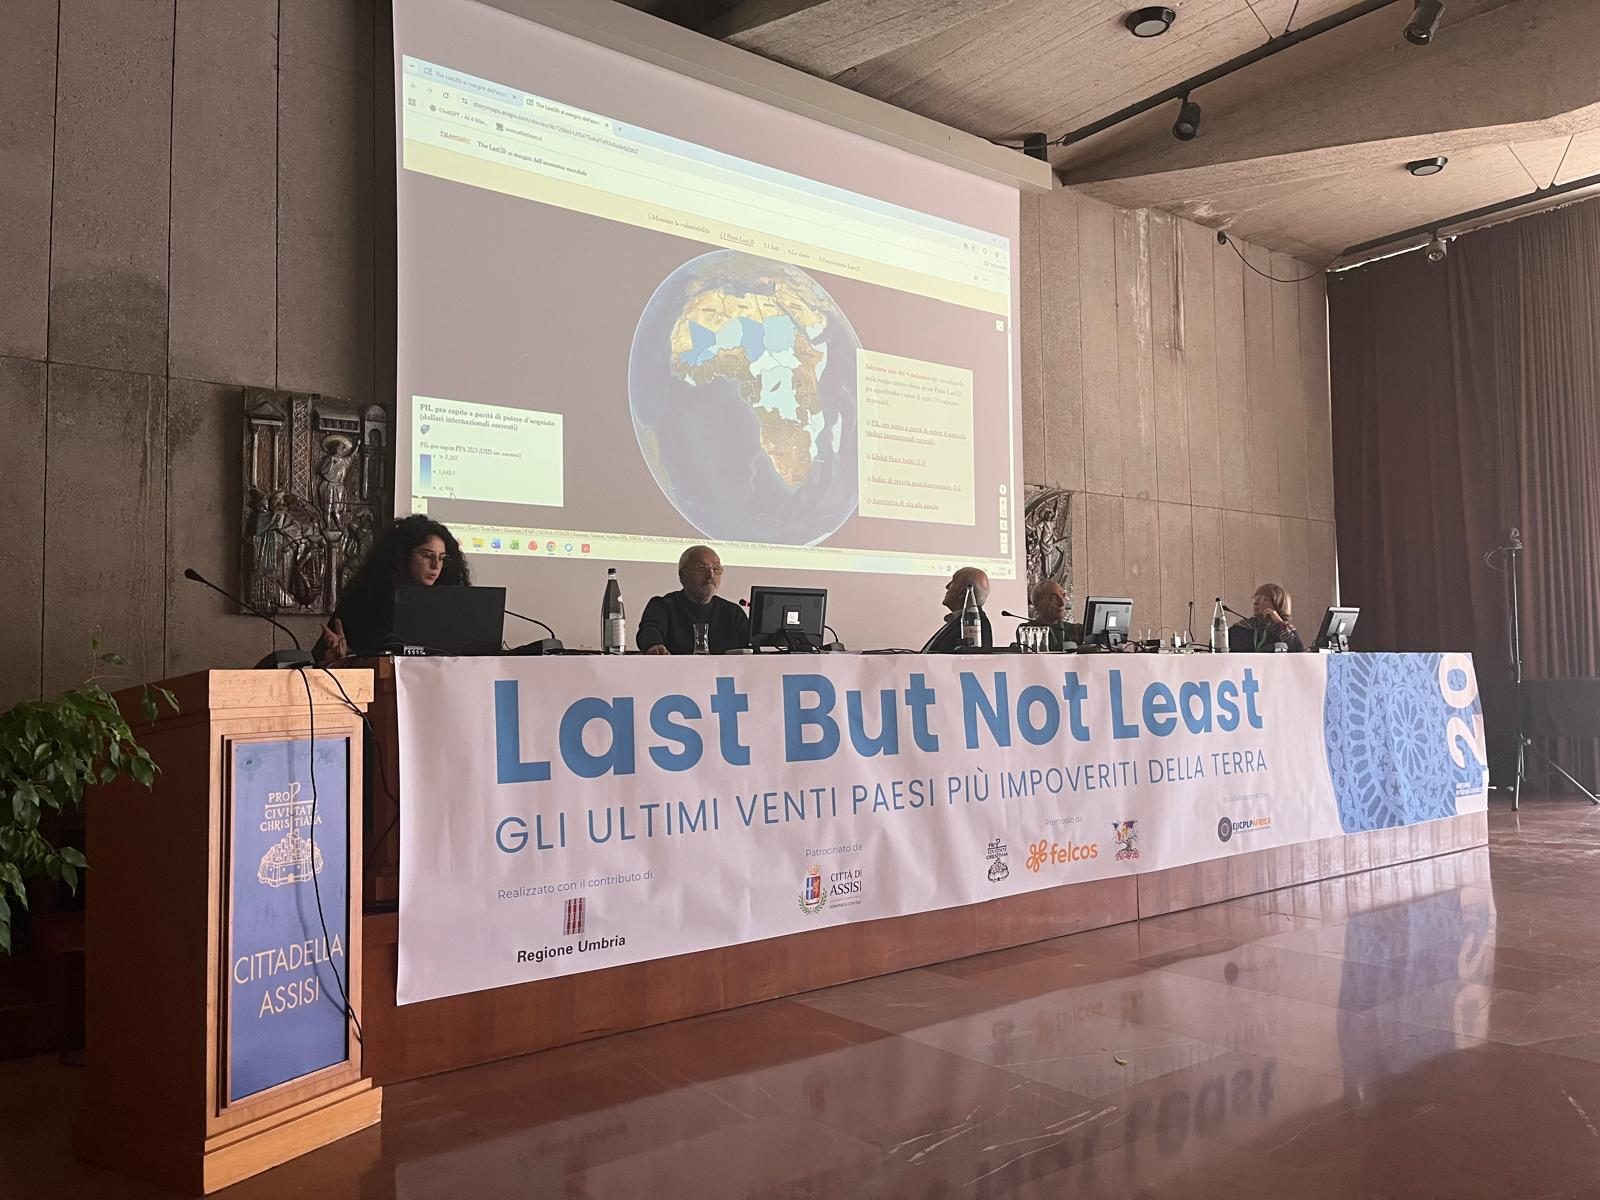
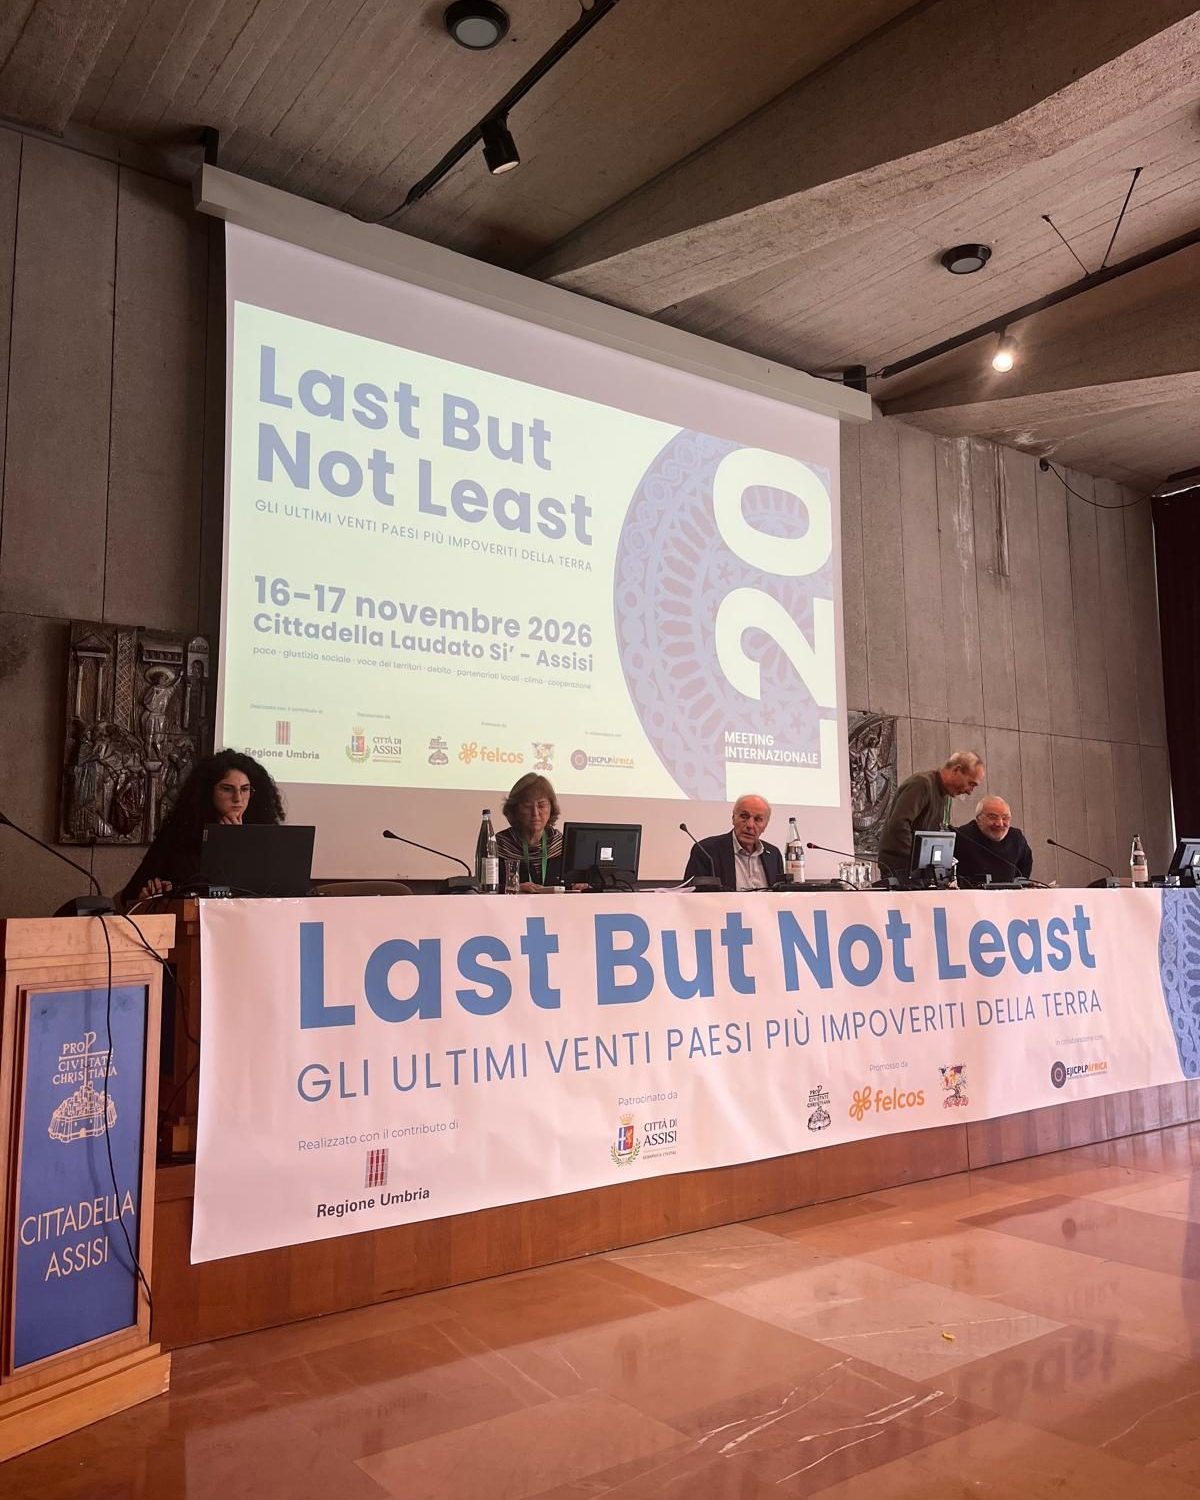
The StoryMap was presented on 16 November 2026 at the Cittadella Laudato Si’ in Assisi, during the international meeting L20 – Last But Not Least. The last twenty most impoverished countries on Earth. Two days of dialogue between institutions, international cooperation, universities, journalists, diaspora representatives, civil society and students from schools and universities in Umbria, to read the great transformations of our time through the lens of the L20 countries and move beyond emergency narratives.
The starting point is a gap that keeps widening: in 2025, average GDP per capita in the L20 countries was 2,155 international dollars at purchasing power parity, against 48,434 in the G20, a ratio of roughly one to twenty-two (in 2005 it was one to ten). The twenty countries are home to 544 million people, and fifteen of them are in Africa.
The meeting was promoted by Pro Civitate Christiana, FELCOS Umbria and Last20 APS, with funding from the Umbria Region, under the patronage of the City of Assisi and in collaboration with EJICPLP África.
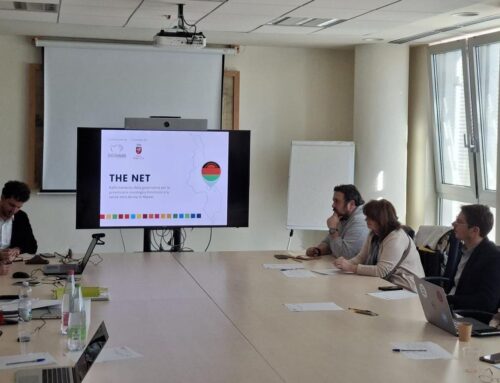
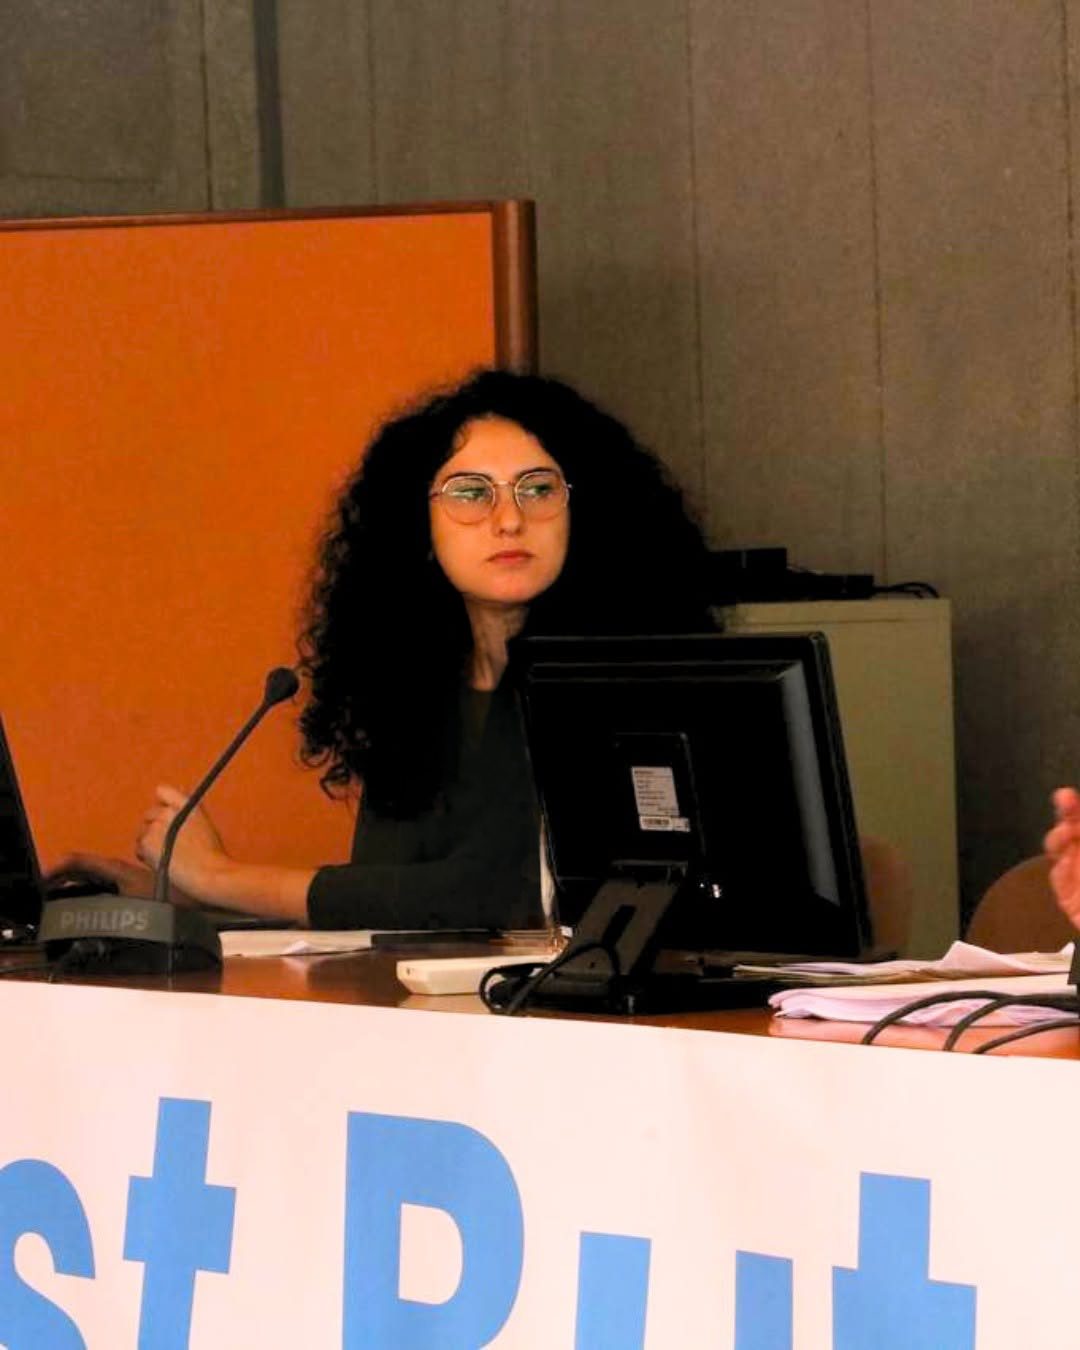
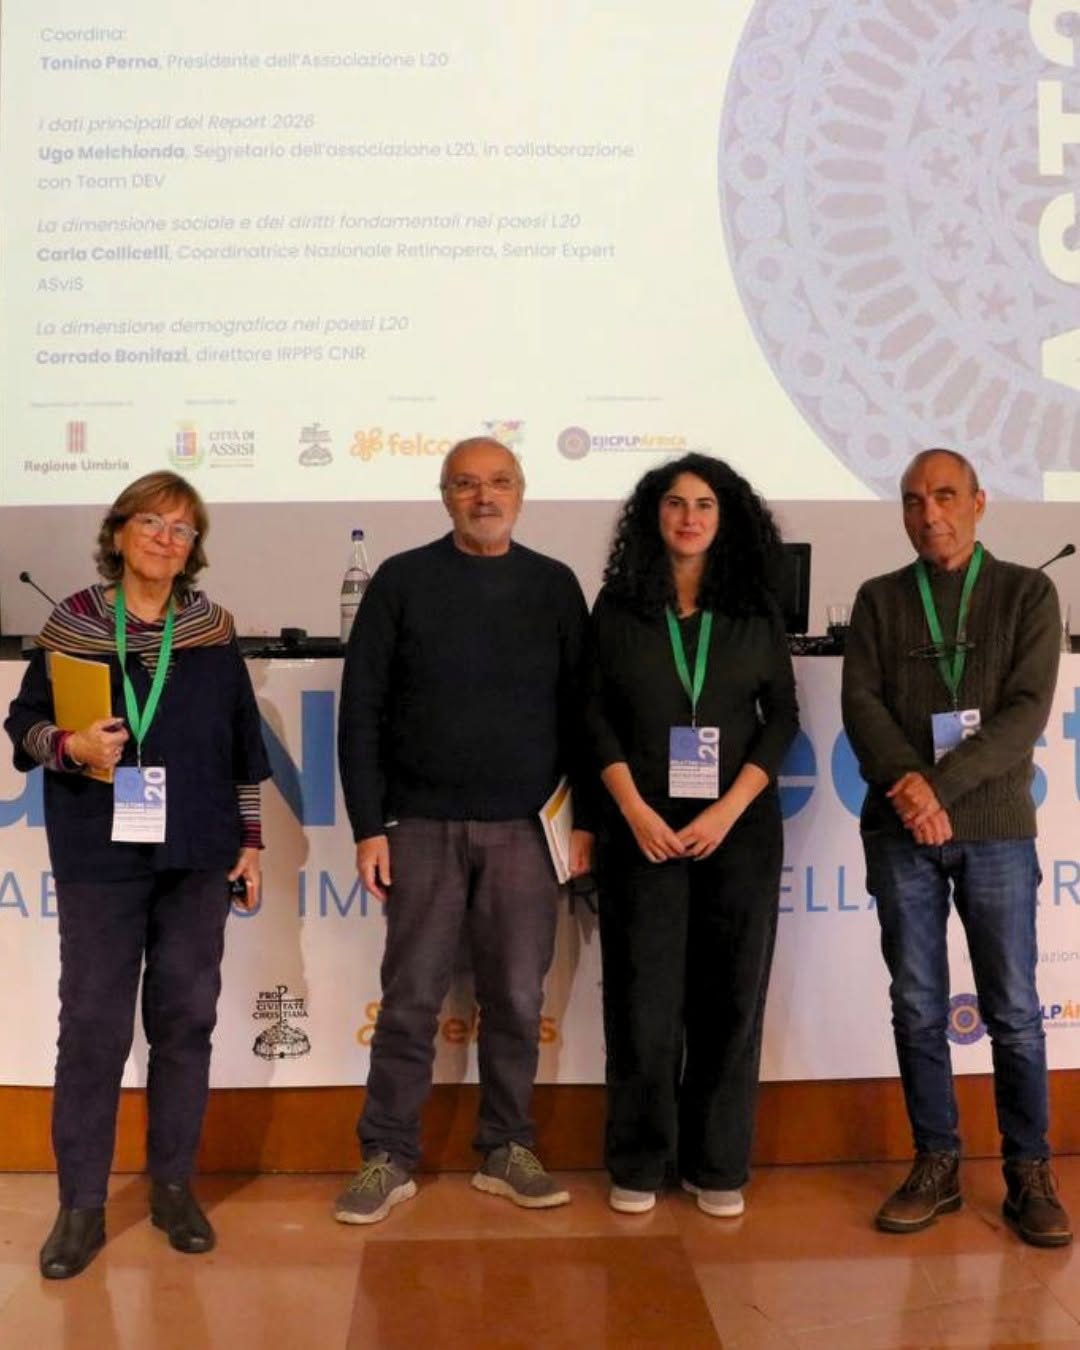
In the session on the key findings of the 2026 Report, chaired by Tonino Perna, Dina El Berjawi of TeamDev Ecosystem walked the audience through the StoryMap together with Ugo Melchionda, secretary of the Last20 association: from the map of the twenty countries to the indicators and the stories of individual places.
For the report, this is an important step: an open tool that anyone can consult, designed to reach far beyond specialists, from students to people working in cooperation and public institutions. It is also a concrete contribution to the meeting’s goal: building a permanent L20 Observatory and making Assisi an annual meeting point dedicated to these countries.
Who we worked with
The LAST20 Report is produced by Last20 APS, an Italian association working to raise public awareness of conditions in the world's most marginalised countries. The report is coordinated by Tonino Perna and Ugo Melchionda, with contributions from researchers, NGOs, academics and civil society organisations, including FOCSIV.