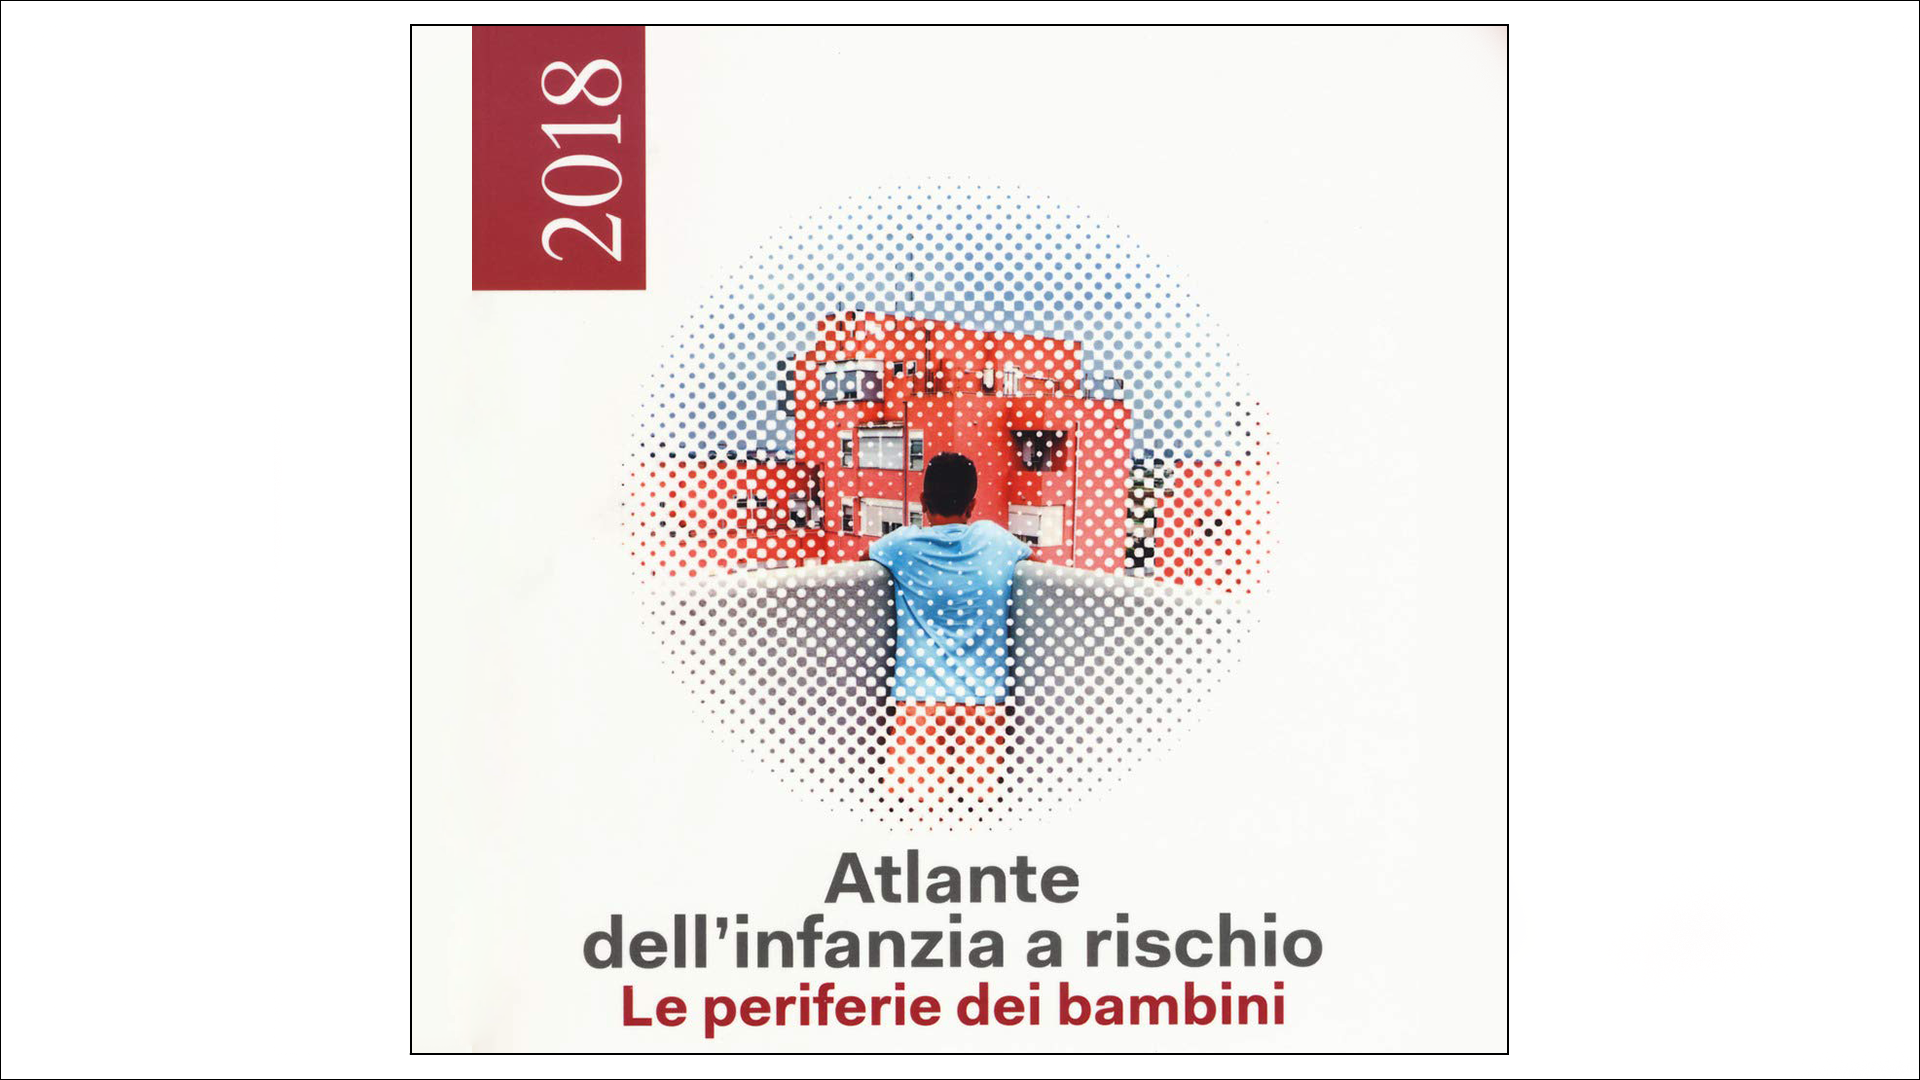
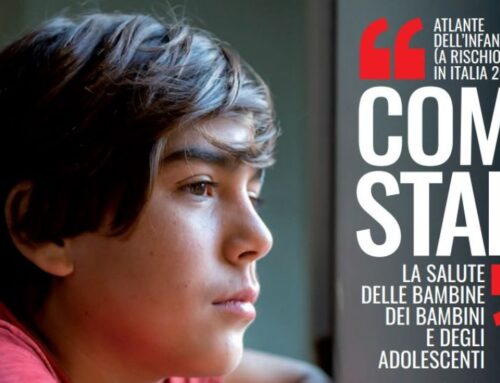
Atlas of Childhood and StoryMap: Save the Children’s 2018 edition “Children’s Peripheries” travels the suburbs of Italy to describe the difficulties of the children who live there.
The focus of the 2018 Atlas is on spaces and suburbs, considered the new “children’s cities”. In these urban areas there is often a lack of safe spaces for play, culture, sports and encounters, services that are far from the social and educational needs of children. This distance produces dramatic effects, because the poverty of spaces and services is more harmful than economic poverty itself.
Needs: using data to highlight issues
The 2018 Atlas uses statistical and social research data to show the correlation between territories and social and economic imbalances.
The environment in which children grow up greatly conditions their future and opportunities for growth. Within the same city, there are neighbourhoods that can mean social redemption and suburbs that lead to the horizon of poverty and inequality.
Telling the story of children’s conditions in cities – complete with up-to-date data and georeferenced maps – is the first step on a path that aims to stimulate decision-makers to intervene with courageous policies and adequate resources.
Solution: Atlas and StoryMap
gisAction has elaborated data and indicators in GIS for the realization of maps and graphs that describe in an evident way the territorial differences. Using specific GIS tools, various types of comparative analysis have been carried out on the data, giving a new and complete vision of the phenomena that we want to investigate.
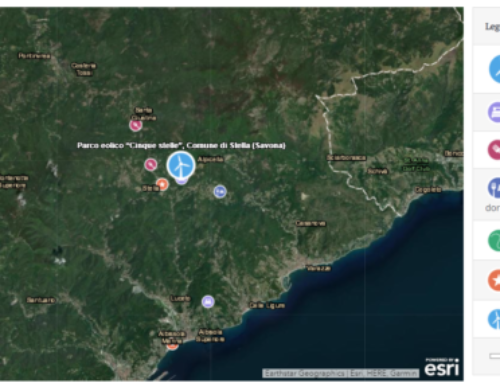
The interactive maps offer a real cross-section of children’s conditions and inequalities in the Italian territories.
Benefits
Maps, charts and infographics allow you to clearly communicate a data or phenomenon to a wide audience. Reading a map is easier and more immediate than understanding data displayed in a table. This type of graphic support makes it pleasant and non-trivial to present a variety of information.
The GIS software with which the maps are created also allows you to cross-reference data sets to obtain new information useful for the analysis of a phenomenon.
StoryMap
gisAction has developed the StoryMap to disseminate on the web an extract of the contents, texts, maps and images of the Atlas.
The StoryMap allows to integrate to the texts all the multimedia contents that help to describe phenomena and reality: images, videos and maps. The maps can be interrogated and navigated to learn about the details of the data. The videos that intersperse the texts provide concrete evidence of the Organization’s work and the realities in which it works.
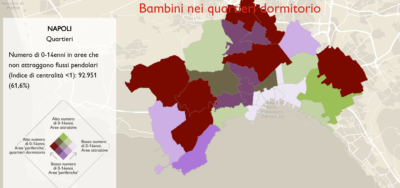
Through the ratio of the number of commuter flows entering the area to the number of commuter flows leaving the area, the centrality index measures the attractiveness of a given area relative to the rest of the city.
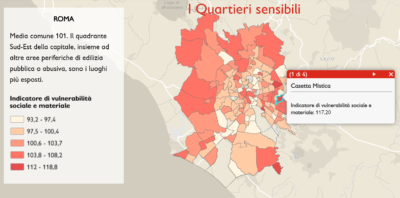
The social vulnerability index is calculated by combining seven elementary indicators that describe educational level, family structures, housing conditions, labor market participation, and economic conditions.
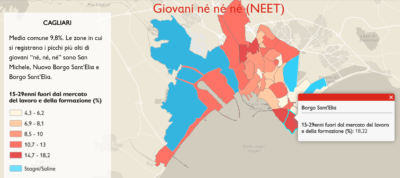
The cartograms show the distribution of the 15-29 year old NEET population, an acronym for “Not in Education, Employment or Training”.
Atlas 2018 presentation at the Chamber of Deputies
Presentation of the Atlas of Childhood at Risk 2018 by Save the Children and Treccani, at the Chamber of Deputies, Sala della Lupa.
Video recording of the debate entitled “Children’s Peripheries – Presentation of the Atlas of Childhood at Risk 2018”, recorded in Rome on Thursday, November 15, 2018 at 10:30 am.
StoryMap 2018 – Atlas of childhood at risk
Watch the interview to learn how the project started
Who we worked with

Save the Children Italia is a non-profit organization established in 1998. It is part of the Save the Children International network, one of the largest independent International Organizations.
